
You are using an out of date browser. It may not display this or other websites correctly.
You should upgrade or use an alternative browser.
You should upgrade or use an alternative browser.
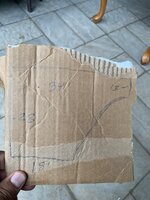
Help with finding the area of a irregular shape
- Thread starter ive
- Start date
LeeG
Well-known member
2 rectangles and a triangle
18*28=504
(34-18)*13=16*13=208
(34-18)*(28-13)/2=16*15/2=120
504+208+120=832
18*28=504
(34-18)*13=16*13=208
(34-18)*(28-13)/2=16*15/2=120
504+208+120=832
another way to calculate
there's a rectangle 34x13=442sqft
and the lower section, double it to make another rectangle then divide by 2 52x15/2 = 780/2=390 sqft
442+390=832sqft
there's a rectangle 34x13=442sqft
and the lower section, double it to make another rectangle then divide by 2 52x15/2 = 780/2=390 sqft
442+390=832sqft
toolenthusiast
Well-known member
- Joined
- Jan 21, 2017
- Messages
- 723
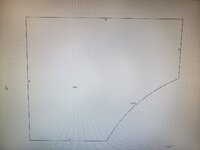
This is correct. I also drew it out, since OP doesn’t seem like a mathlete2 rectangles and a triangle
18*28=504
(34-18)*13=16*13=208
(34-18)*(28-13)/2=16*15/2=120
504+208+120=832


steaks&anvils
Well-known member
Wow math! I hate math...
I was going to suggest drawing it on graph paper and counting the squares...
I was going to suggest drawing it on graph paper and counting the squares...
RTM
Well-known member
The good news is you all got the same answer. It would look bad for Ive if you had three numbers off by more than 5’.
Indexmill
Well-known member
If you don't like math, just approximate the rectangle, multiply the 2 numbers and buy the sod... Don't over-think it.
finn
Well-known member
Should have done that homework in High School.
Gentlemen, thank you very much. I’m humbled by your kindness(especially leeg and toolenthusiast)
The sod is for my mother in law, so being bang on with the order makes me look good. Know you guys helped me more than you know.
Truly appreciated. And my math does ****.
The sod is for my mother in law, so being bang on with the order makes me look good. Know you guys helped me more than you know.
Truly appreciated. And my math does ****.
zak77
Well-known member
That is what computers are forCommon core math.
OP -> if you really want to be 'bang on' you need a couple of more measurements to plot out the curve (see photo). Measure the distance to the curve from the top (34') down to the curve, keeping parallel to the right edge every 4' or so


larry4406
Well-known member
The OP will still need to then convert square feet to rolls of sod 


mike93lx
ALLIANCE MEMBER
42 is the answer, obviouslyI came up with 19.
steaks&anvils
Well-known member
Is that like adjusting for the metal gauge of a vintage gas can when filling it?The OP will still need to then convert square feet to rolls of sod


steaks&anvils
Well-known member
With sod, I found that the waste can add up fast. So over buy and save the trip to get more. Waste does work for filling in odd holes or dead spots in another yard.
FYI, the sod company I used was great about replacing bad rolls. I just took the bad rolls back when I returned their delivery pallets.
FYI, the sod company I used was great about replacing bad rolls. I just took the bad rolls back when I returned their delivery pallets.
RTM
Well-known member
I buddy of mine re calculated his by "whole pieces", and found that to use the sq ft originally figured, he would have had to piece a bunch of squares together. He ended up overbuying by 15% or so, to allow the minimal piecing of the scraps.With sod, I found that the waste can add up fast. .
mike93lx
ALLIANCE MEMBER
Overbuying 10% on basically anything that needs to be cut to cover an area is usually necessary. Siding, tile, pavers, etc.I buddy of mine re calculated his by "whole pieces", and found that to use the sq ft originally figured, he would have had to piece a bunch of squares together. He ended up overbuying by 15% or so, to allow the minimal piecing of the scraps.
Trying to get it spot on usually results in extra trips and mismatches products
beemerphile
Well-known member
I had a really irregular shape to calculate once, so I printed it and cut out the area. Then I cut out a 10'x10' segment and weighed both papers. Area = (weight of the irregular area / weight of 10x10 segment) x 100 sq. ft.
mike93lx
ALLIANCE MEMBER
How did that work out? Feels like a huge margin for error unless you have a very accurate and precise scaleI had a really irregular shape to calculate once, so I printed it and cut out the area. Then I cut out a 10'x10' segment and weighed both papers. Area = (weight of the irregular area / weight of 10x10 segment) x 100 sq. ft.
I had a really irregular shape to calculate once, so I printed it and cut out the area. Then I cut out a 10'x10' segment and weighed both papers. Area = (weight of the irregular area / weight of 10x10 segment) x 100 sq. ft.
A 10’x10’ piece of paper is pretty big! Need a big printer for that too.How did that work out? Feels like a huge margin for error unless you have a very accurate and precise scale
aka Larry
Well-known member
The OP will still need to then convert square feet to rolls of sod
Isn't sod still sold by the square yard? If so, more math...
JABgj
Well-known member
Sort of related, I had to find the volume of a irregular space (spray cabinet) and stumbled on a formula on a website that was about designing and building speaker cabinets. Solved the problem and passed inspection.
mike93lx
ALLIANCE MEMBER
I assumed that was a typo. Most paper machines aren't even that bigA 10’x10’ piece of paper is pretty big! Need a big printer for that too.
bwringer
Well-known member
Yeah, this is sod, not space shuttle tile. Ballpark numbers are fine.
I was once totally astonished when I laid laminate flooring in a spare bedroom, and -- you'll never believe this -- the formula on the box actually turned out to be quite accurate as to how many boxes I needed. Fortunately, I was able to return the unopened excess easily. I was so used to being screwed over by horrible lies and fictions that I bought about 130% of what I needed, then added a box just to make sure. OK, two boxes extra...
The experience of laying flooring in the living room a few years before was pretty traumatic. There was no more of that pattern to be found at any Home Depot within reach, and I was literally salvaging scraps to finish the last bit. My last cut was highly complex, and my very last chance with the material I had.
I've still never seen a formula for paint coverage that bore the slightest relation to reality. I usually double those numbers and I still usually run short.
nadogail
Well-known member
There is a proven method of arriving at a very close estimate of the area of an irregular flat area. It involves measuring the length of regularly spaced line and averaging the length of the lines.
minke
Well-known member
The triangle & rectangle area sums are probably the best approach.
OTOH, as a high school metal shop project we had to make hatchet planimeters. Their intent, for better or worse, is to measure area. For the curious: http://members.iinet.net.au/~dgreen/PlanimeterVault/hatchet/hatchet.html https://en.wikipedia.org/wiki/Planimeter
My handheld GPS (Garmin GPSMAP 64) will calculate an area when you walk the perimeter. I'd guess that it would be rather inaccurate with a parcel this small.
beemerphile
Well-known member
Ok, clarification. 10'x10' on a piece of paper scaled the same as the plot that I cut out. The plot was scaled to 1/2"=1', so the 10x10 scaled square was 5" on each side. I actually plotted the reference square on the same drawing. There are four keys to accuracy with the method. 1) An accurate gram scale; 2). paper with good basis uniformity (I used vellum); 3). print the plot as large as possible; and 4) size your reference square so as to keep the ratio reasonable (say 2:1 to 4:1. I have an HP DesignJet plotter and a good gram scale.A 10’x10’ piece of paper is pretty big! Need a big printer for that too.
BTL-A4
Well-known member
Convert all your measurements into "rolls of sod" (RoS). If a sod roll is 18" x 80" (10 sq ft), then the big rectangle is 12 rolls x 4.2 rolls=50.4 RoS, the small rectangle is 10.7 x 1.9 rolls=20.3 RoS and the triangle is (2.2 rolls x 10.7 rolls)/2=11.8 RoS. Add them up and you get 82.5 rolls (RoS). This is about 825 sq ft, not far from the 832 sq ft you get if you use feet. Round up the measurements and you get 84 rolls of sod, which should be enough.
In the old days, there was special paper for this, because it was the most reliable way to figure out areas under the curve of things you can plot, but can't integrate. the areal density of typing paper can vary by a lot, something like 5% sheet to sheet, and quite a lot even in the same sheet.Ok, clarification. 10'x10' on a piece of paper scaled the same as the plot that I cut out. The plot was scaled to 1/2"=1', so the 10x10 scaled square was 5" on each side. I actually plotted the reference square on the same drawing. There are four keys to accuracy with the method. 1) An accurate gram scale; 2). paper with good basis uniformity (I used vellum); 3). print the plot as large as possible; and 4) size your reference square so as to keep the ratio reasonable (say 2:1 to 4:1. I have an HP DesignJet plotter and a good gram scale.
beemerphile
Well-known member
That is why I used vellum which is very consistent. Lot to lot and sheet to sheet variation were removed by plotting the reference square on the same page with the area of interest. A lot of nay-saying on this. I'm through defending it. It got me an answer in my case. I just pointed it out because it was a different, and I thought, interesting way to solve the riddle. The greater interest seems to be in shooting it down.In the old days, there was special paper for this, because it was the most reliable way to figure out areas under the curve of things you can plot, but can't integrate. the areal density of typing paper can vary by a lot, something like 5% sheet to sheet, and quite a lot even in the same sheet.
I need to stay away from the Post Reply button. I have the right to remain silent, but not the ability.
It’s a neat idea and apparently it works for you. No need to defend yourself if it works.That is why I used vellum which is very consistent. Lot to lot and sheet to sheet variation were removed by plotting the reference square on the same page with the area of interest. A lot of nay-saying on this. I'm through defending it. It got me an answer in my case. I just pointed it out because it was a different, and I thought, interesting way to solve the riddle. The greater interest seems to be in shooting it down.
I need to stay away from the Post Reply button. I have the right to remain silent, but not the ability.
rlitman
Well-known member
Wait a second guys. We've totally missed the mark here. What he needs is to buy a new tool!
A planimeter would exactly solve this issue, and be a totally unnecessary expense to boot.
A planimeter would exactly solve this issue, and be a totally unnecessary expense to boot.
RTM
Well-known member
The correct way to verify this works is to lay out one roll on the one edge, and see how much is left over. If you have 1/10th of a roll at the end of one column, after 10 columns, you either need to piece 10 little ones together to get one full one, or need an extra roll.Convert all your measurements into "rolls of sod" (RoS). If a sod roll is 18" x 80" (10 sq ft), then the big rectangle is 12 rolls x 4.2 rolls=50.4 RoS, the small rectangle is 10.7 x 1.9 rolls=20.3 RoS and the triangle is (2.2 rolls x 10.7 rolls)/2=11.8 RoS. Add them up and you get 82.5 rolls (RoS). This is about 825 sq ft, not far from the 832 sq ft you get if you use feet. Round up the measurements and you get 84 rolls of sod, which should be enough.
Looking at his drawing, 28 ft is 4.2 rolls, so that will work out well. The 0.8 rolls can be used for the brickwork offset, to fit into to the triangle, etc. the 18’ dimension will require 10 columns, yeah. At the small end, 13 ft is 1.95 rolls, and increasing, so some small pieces can fill the edge of the triangle as you work your way out to 28 foot dimension.
Last edited:
Meursault74
Well-known member
Used to do this a lot in college with "integrating peaks" in chromatography, when we didn't have a computer and software connected to the instrument. We were allowed one run with the plotter paper (which is still expensive), we'd make photo copies of it, cut out the peaks and weigh them and average out results. I recall getting precise results with whatever was in the copy machines.In the old days, there was special paper for this, because it was the most reliable way to figure out areas under the curve of things you can plot, but can't integrate. the areal density of typing paper can vary by a lot, something like 5% sheet to sheet, and quite a lot even in the same sheet.
I haven't done that since and thought about suggesting this, but the answer was already figured out.
laser3kw
Well-known member
approximately 80sq meters